Viewing Sessions
Monitor and review AI activity in the dashboard.
A session is a single connection between your AI tool and Edison Watch.
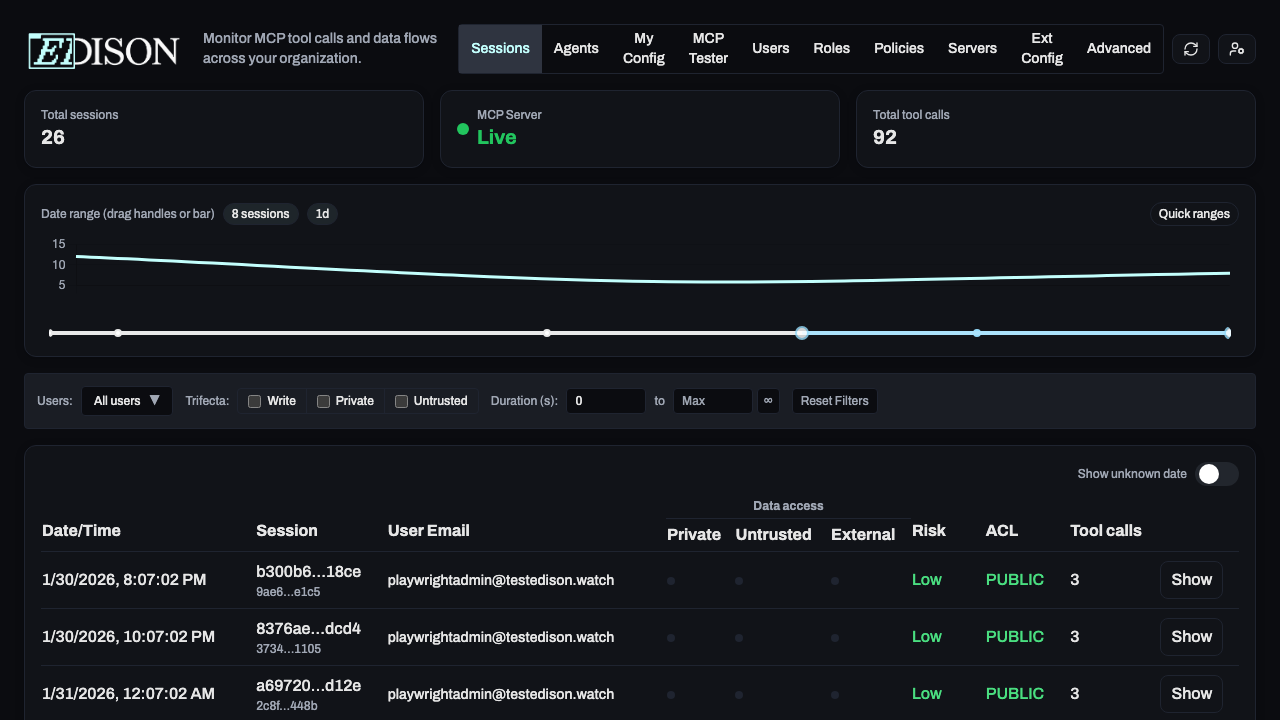
The Sessions View
Go to Sessions in the sidebar to see all activity.
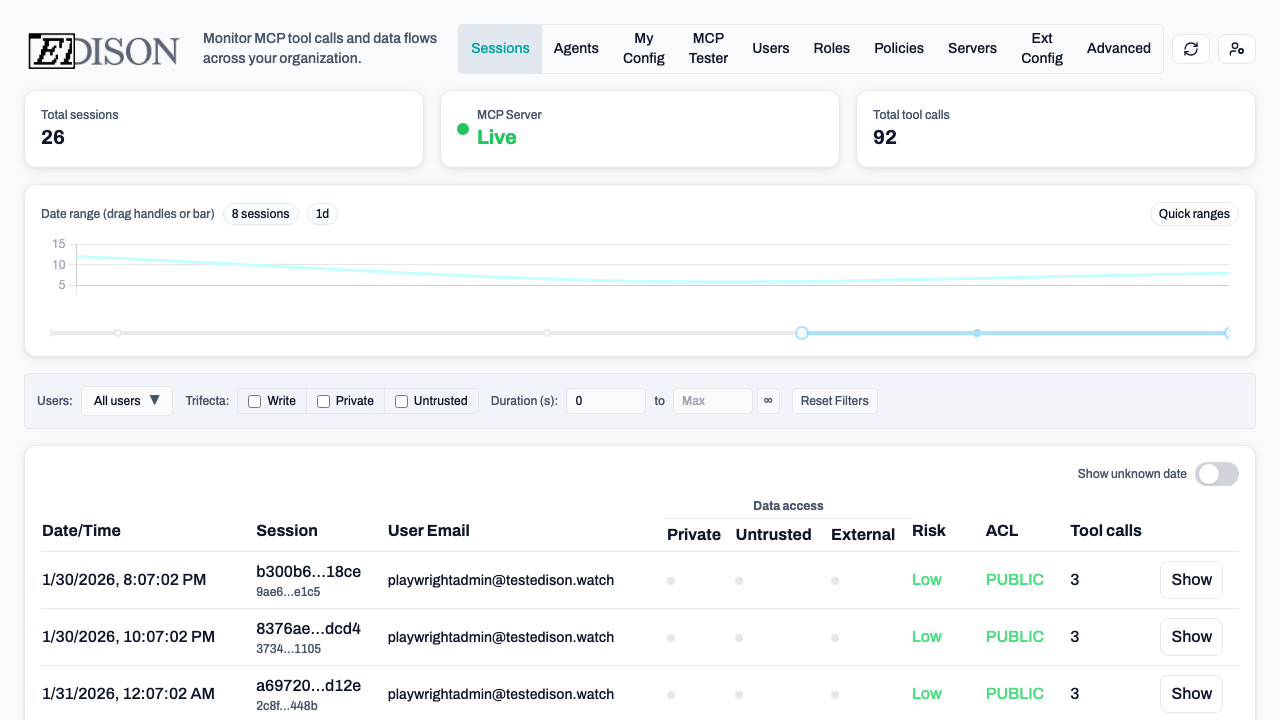
| Column | Description |
|---|---|
| Time | When the session started. |
| User | The person who started the session. |
| Agent | The AI agent (e.g. Claude, Cursor). |
| Calls | Total tool calls in the session. |
| Status | Whether the session is active, completed, or blocked. |
| Risk | Low (green), Medium (amber), or High (red). |
| ACL | Highest sensitivity level accessed (PUBLIC, PRIVATE, SECRET). |
| P/U/E | Colored dots: Private (blue), Untrusted (amber), External (red). |
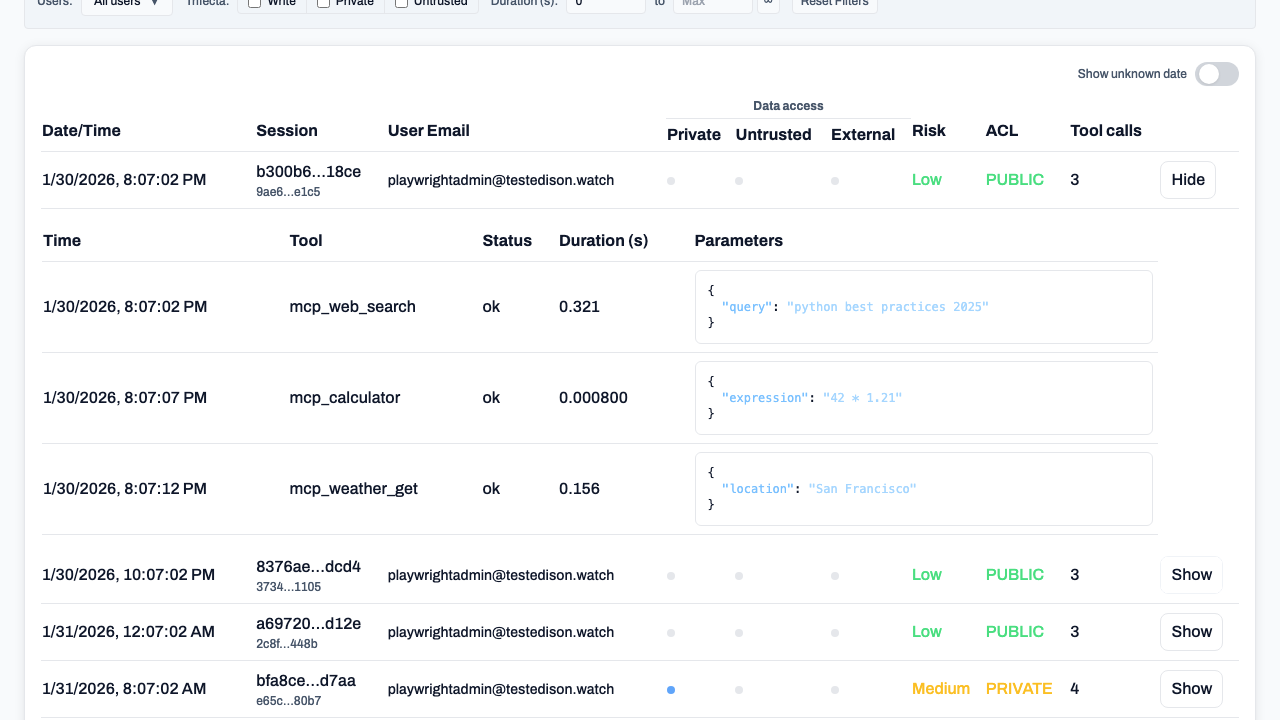
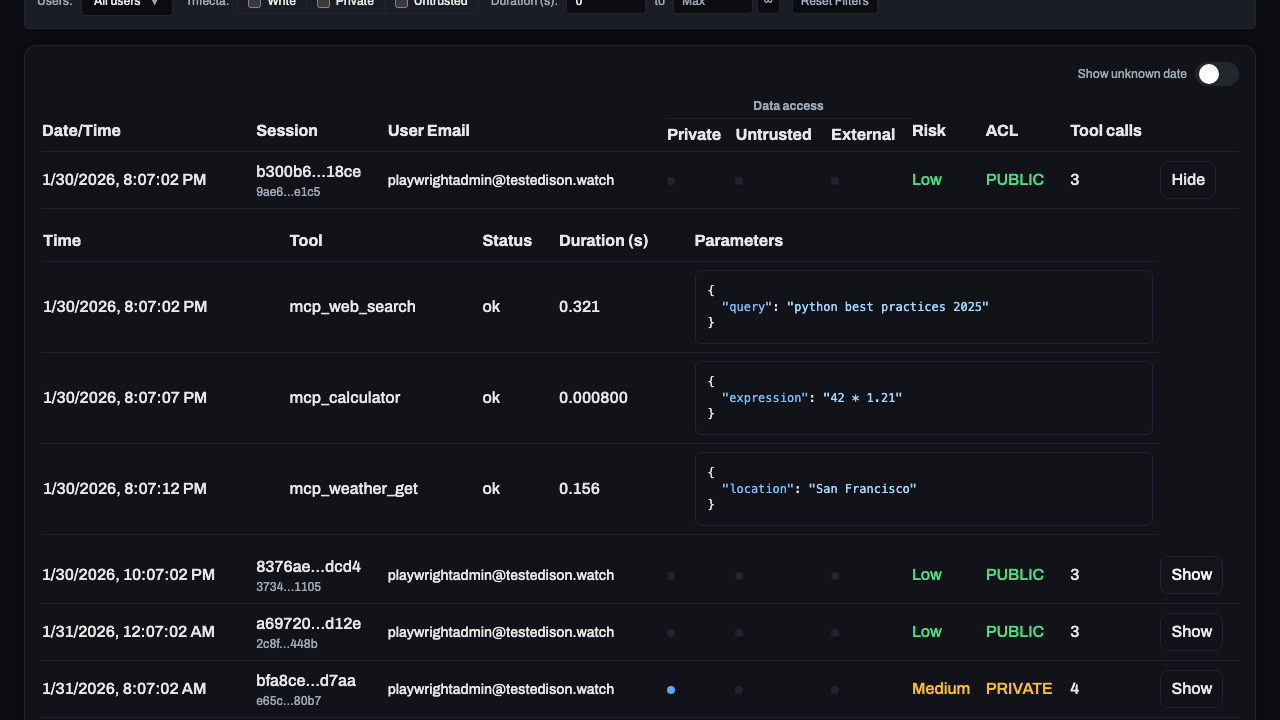
Session Details
Click Show on any row to see the full timeline:
- Timeline: Chronological list of every tool the AI used.
- Parameters: Exact arguments passed to the AI (click Expand for details).
- Status: Whether each call was successful, blocked, or pending.
Filtering
Use the toolbar to find specific activity:
- Private Data: Sessions that accessed private files or internal data.
- Untrusted Content: Sessions that fetched content from the web or external APIs.
- External Comm: Sessions that sent data externally (email, Slack, APIs).
- Trifecta: Sessions with all three flags set — the highest-risk combination.
- Date Range: Use the date picker to select a time window.
- Users: Filter by team member.
- Agents: Filter by AI agent.
ACL Levels
The ACL column indicates the most sensitive data handled:
| Level | Meaning |
|---|---|
| PUBLIC | No sensitive data accessed. |
| PRIVATE | Internal/confidential data accessed. |
| SECRET | Highly sensitive data accessed. |
Pro Tip: Combine filters to investigate risks, like "High-risk sessions that accessed SECRET data."