Dashboard Overview
Navigate the Edison Watch dashboard and understand its main features.
The dashboard is your command center for monitoring and controlling AI activity across your organization.
Layout
The dashboard uses a sidebar on the left for navigation and a main content area on the right.
Sidebar Navigation
| Section | Who sees it | Purpose |
|---|---|---|
| Overview | All users | Pending requests and security insights. |
| Sessions | All users | Monitor AI session history and tool calls. |
| My MCPs | All users | View and test your personal MCP servers. |
| Settings | All users | Encryption keys, credentials, and preferences. |
| Servers | Admins | Manage MCP servers for the organization. |
| Users | Admins | Manage users, roles, and invitations. |
| Policies | Admins | Create and manage CEL-based policy rules. |
| Access Control | Admins | Configure roles and element-level permissions. |
| Logs | Admins | Audit logs and system activity. |
Header
Each page shows a Docs link in the header (book icon) that opens the documentation for that specific page.
Admins with multiple organizations see an org filter dropdown to scope the view to a single org or view all orgs at once.
Overview Page
The Overview page (/dashboard/overview) is the landing page after sign-in. It shows:
- Pending server requests — users requesting access to new MCP servers.
- Pending quarantine requests — servers blocked by the client app awaiting approval.
- Security insights — recent policy violations and risk patterns (admins only).
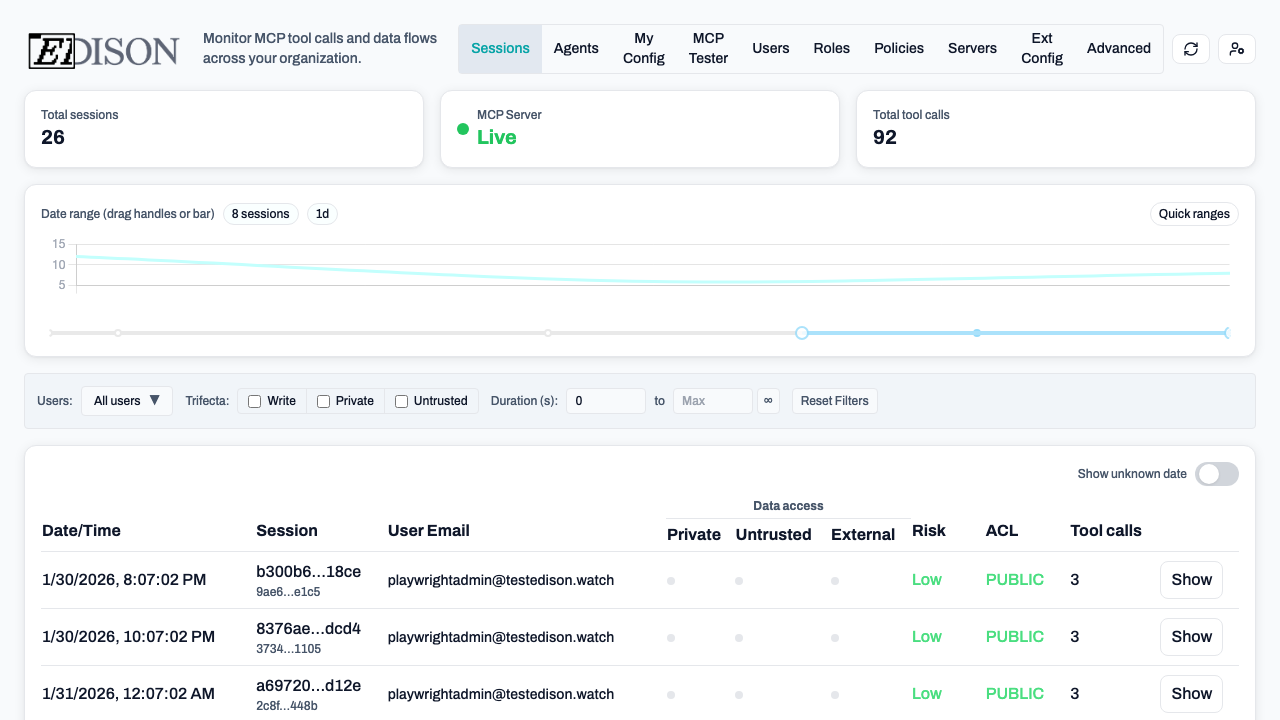
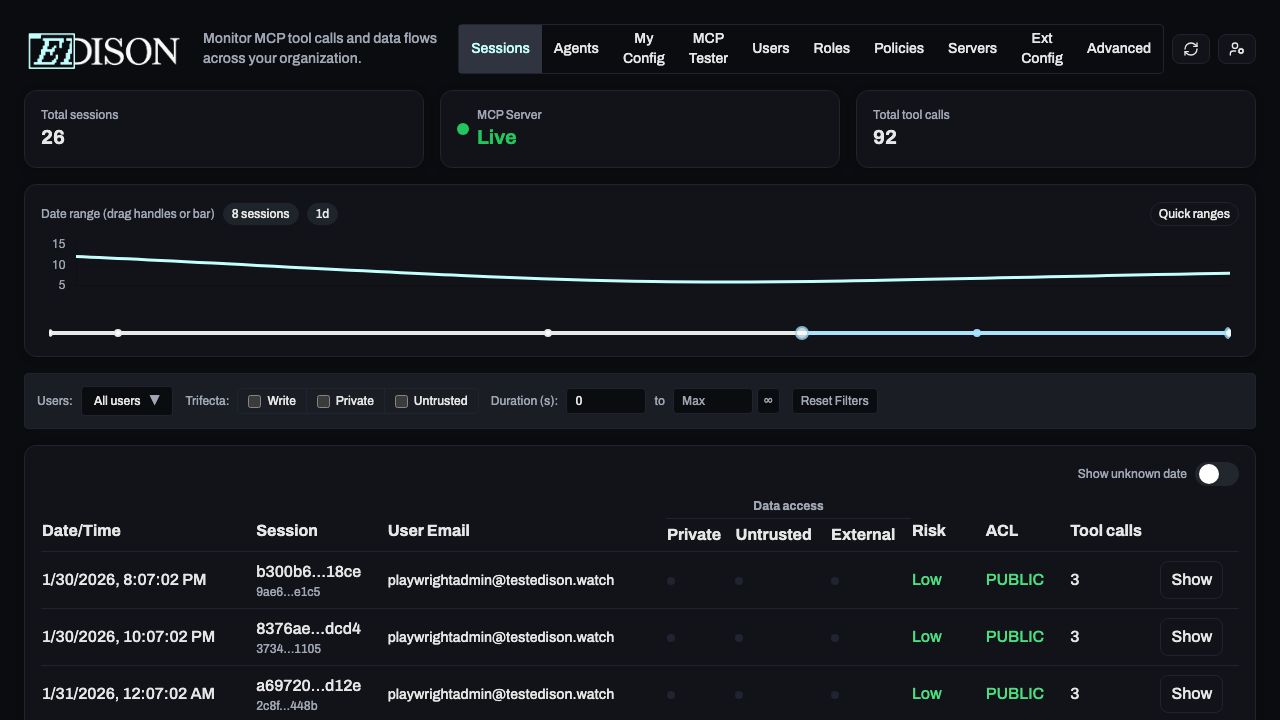
Sessions View
The Sessions view at /dashboard/sessions is the primary monitoring interface.


Each row in the sessions table shows:
| Column | Description |
|---|---|
| Time | When the session started. |
| User | The person who started the session. |
| Agent | The AI agent (e.g. Claude, Cursor). |
| Calls | Total tool calls in the session. |
| Status | Active, completed, or blocked. |
| Risk | Low (green), Medium (amber), or High (red). |
| ACL | Highest sensitivity level accessed. |
| P/U/E | Colored dots: Private (blue), Untrusted (amber), External (red). |
Click Show on any row to expand the full tool call timeline.
Understanding Security Flags
Edison Watch tracks three data-flow flags per session:
| Flag | Dot | Triggered by |
|---|---|---|
| Private data | Blue | Reading files, databases, or internal documents. |
| Untrusted content | Amber | Fetching web content or calling external APIs. |
| External comm | Red | Sending emails, Slack messages, or external API calls. |
A session with all three flags set is a Trifecta — the highest-risk combination. Use the Trifecta filter on the Sessions page to find these sessions.
Risk Levels
| Level | Flags | Indicator |
|---|---|---|
| Low | 0 | Green |
| Medium | 1 | Amber |
| High | 2+ | Red |
ACL Levels
| Level | Meaning |
|---|---|
| PUBLIC | No sensitive data accessed. |
| PRIVATE | Internal/confidential data accessed. |
| SECRET | Highly sensitive data accessed. |
Tip: Use the date range filter and security flag filters together on the Sessions page to investigate specific incidents.